
Interesting changes to Arc Agent 1.34 with expanded detected properties
Microsoft just pushed out a change in Azure Arc Connected Agent 1.34 and with this comes some enrichment of Hybrid Servers detected properties.
This is what the properties looked like prior to the update.
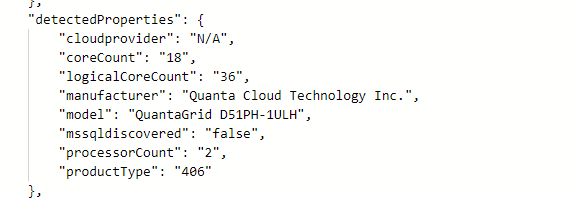
Agent 1.33 and earlier
Okay… so what’s new and different?

New detected properties for Azure Arc Connected Agent 1.34
serialNumber, ProcessNames and totalPhysicalMemory
resources
| where ['type'] == "microsoft.hybridcompute/machines"
| extend processorCount = properties.detectedProperties.processorCount,
    serialNumber = properties.detectedProperties.serialNumber,
    manufacturer= properties.detectedProperties.manufacturer,
    processorNames= properties.detectedProperties.processorNames,
    logicalCoreCount = properties.detectedProperties.logicalCoreCount,
    smbiosAssetTag = properties.detectedProperties.smbiosAssetTag,
    totalPhysicalMemoryInBytes = properties.detectedProperties.totalPhysicalMemoryInBytes,
    totalPhysicalMemoryInGigabytes = properties.detectedProperties.totalPhysicalMemoryInGigabytes
| project name,serialNumber,logicalCoreCount,manufacturer,processorCount,processorNames,totalPhysicalMemoryInBytes,totalPhysicalMemoryInGigabytes
This unlocks organizations to collect processor, serial number and memory information in a simple fashion via Azure Arc infrastructure. This can be used to look at things like consolidation and migration planning, perhaps decommissioning aging hardware even warranty lookup if you don’t have current hardware CMDB.


Feature Parity for Azure Arc Server Resource Types?
When is an Azure Arc Server; not an Arc Server? A look at Azure Arc Server Resource types and the lack of feature parity between them
This is an Azure Arc Server (Server)

This is an Azure Arc Server (VMware)

This is an Azure Arc Server (HCI)

Introduction
Yes! Yes, Same Same… but different. Okay, so what? Not all Azure Arc Server VM objects are created equal. If we look a little closer at the Azure Resource Types we can see there are three different types listed here;
(Server) "type": "Microsoft.HybridCompute/machines"
(VMWare) "type": "microsoft.connectedvmwarevsphere/virtualmachines"
(HCI) "type": "microsoft.azurestackhci/virtualmachines"
Each of these types connecting via different methods to your Azure subscriptions, and along with this comes different functionality.
Server Blades
Let’s take a cursory look at (Server) using the standard connected Azure Connected Machine Agent. Lots of information, server, patch level, settings, operations, monitoring, big buttons to click great, appears feature rich and has the feel of Azure…. what’s your point?
Take note of the menu options on the left. You can also click on an image to enlarge it.
Okay, how about (VMWare)? It seems to be missing a few options and capability compared to the Server.
Well, what about (HCI)? Huh … It seems like its missing even more options.
VM Extensions
Unfortunately, this isn’t where the differences end. Taking a closer look at the Extensions available for each resource type. In particular, let’s say you want to start taking advantage of the new functionality around Arc-Enabled SQL Servers. Now the Arc SQL Extension is meant to Auto install… but only if you are using the (Server) type that is "type": "Microsoft.HybridCompute/machines"
Extension for (Server)
For the other two types, that Arc SQL Server extension is missing.

Extension for (VMware)

Extensions for (HCI)
HCI and VMWare
It is touted that it is easy to install Azure Arc for for your entire vSphere farm, and they are not wrong, you can import up to a maximum of 9500 VMs if you like with very little effort… up front. But you are not being offered all the benefits of an Azure Arc Server. You cant have the Arc SQL extension to monitor, operate and control your SQL Servers anywhere.
Digging into an HCI Cluster, you can Arc-enable the host nodes. These actually appear as first-class citizens of Azure as Azure Arc Servers.
Here is the cluster

and here is one of those nodes.

Here is where you would start the setup for the HCI Resource Bridge Setup, and through this is where you connect servers the HCI clusters guests.

but while the hosts have the full feature set of an Arc Server the HCI cluster guest VMs don’t.
VMware and HCI types are seriously lagging behind Arc Server and missing features and are essentially second-class citizens of Azure compared to the original HybridCompute resource type. You can See Updates, Azure Monitor, and SQL Extensions are all only available for Azure Arc (Server).
Resource Explorer
Through the Resource Explorer in the Azure Portal we can see the different types and more specifically the different ways they have been enabled. (Server)
We can see the (VMWare) which has a number of operations at the cluster level
and (HCI) which also has more operations at the cluster level than at the VM level.
Conclusion
Of course, you can’t install multiple types on the same server. I believe Azure Arc (Server) is the only way to go. Seeing the lack of parity in functionality between these types, it’s worth creating a method to deploy Azure Connected Agent directly on the machine yourself and at scale rather than leveraging time savings tools with the Resource Bridge that allow easy onboarding of vSphere and HCI cluster guests which leverage the Arc Resource Bridge.
That’s not to say the Resource Bridge isn’t useful for K8s or Arc Data Services. However, you should be aware of the lack of feature parity for HCI or VMWare installations of Arc Server Resource Type and make an informed decision about which Resource Type of Azure Arc Server you need or want in your environment.

SQL Counters via Azure Arc
Walk through how to collect SQL counter using Data collection Rule and displaying the results on a workbook an Azure Dashboard.
Microsoft is rapidly expanding the services and features available from the Azure Arc SQL Extension. As this moves into GA and more visibility features get added and importantly, features that allow actions EG controlling backup and even patching using Azure to create a management layer for your SQL Server estate outside of Azure becomes more viable.
Let’s take a brief look at grabbing SQL-specific performance counters to Azure Monitor Metrics.
We need to create a Data Collection Rule (DCR). I am not using Data Collection Endpoints (DCE), but you may want to consider this in your environment.

Select the Arc Resource you want to add
now we need to add some Performance counter

it will add a bunch by default; select None, then Custom to clear all.
Unfortunately, currently, you can not see the SQL counters from this view, so you’ll have to go collect what you want from another source.
You can use Perfmon, unfortunately you cant copy from perfmon.
this query will provide a list
SELECT COUNT(*) FROM sys.dm_os_performance_counters;
Here is a list I have extracted for this DCR
\SQLServer:General Statistics\User Connections
\SQLServer:General Statistics\Logins/sec
\SQLServer:General Statistics\Transactions
\SQLServer:Databases(_Total)\Active Transactions
\SQLServer:SQL Statistics\Batch Requests/sec
\SQLServer:SQL Statistics\Logical Connections
\SQLServer:SQL Statistics\SQL Compilations/sec
\SQLServer:SQL Statistics\SQL Re-Compilations/sec
Paste it in line by line, Add, tick, Delete line, next counter. Adjust the Sample rate as needed. I have used the default 60 seconds. For large SQL servers estates, you might want to consider increasing this depending on your needs.
It’s worth considering building a template for this if you want to do this repeatedly. This resource type has some challenging layers to work through for deployment. Microsoft reference material can be found here.

we pipe these into Azure Monitor Metrics Which is still in preview and for this exercise I will also push the data into a log analytics instance.

as of this writing the metrics for hybrid compute fail to be added to scope of Azure Monitor. For the remainder of this example we will use Log Analytics Workspace for metrics.
Heading over to the Log Analytics Workspace. You can create various Kusto queries to integrate these SQL Metrics
Perf
| where ObjectName == 'SQLServer:General Statistics' and CounterName == 'User Connections'
| project TimeGenerated, Computer, ObjectName, CounterName, CounterValue
| summarize avg(CounterValue) by bin(TimeGenerated,60m) , Computer
| render timechartYou can send this to a Workbook or Dashboard

We can now see the data on a chart in a workbook. By saving the you can give the workbook a name and save it to a resource group

Alternatively, you can publish this to an Azure Dashboard. I am going to use the dashboard I created here Arc SQL Extension - Best Practices Assessment — Crying Cloud

This displays a tile here. You can continue to add tiles and edit the queries. You build workbooks and dashboards to target the specific metrics about your Arc-enabled SQL Servers.

Arc SQL Extension - Best Practices Assessment
A look into Azure Arc SQL Extension and how best practices assessment and what it can extract from an Azure Arc enabled SQL Server.
Azure Arc help increase the visibility of your IT estate outside of Azure. Layering on top of the SQL Extension, we can bring a centralized view of your SQL Servers and databases, and now other control features help with management activities.
Let’s take a look at the Best practices assessment (BPA)

First thing to know is “Best practices assessment is only available for SQL Server with Software Assurance, SQL subscription, or with Azure pay-as-you-go billing. Update the license type appropriately. Learn more”

If you want to look at you’re overall licenses we can run a query against the Azure Resource Graph. While we are at it lets add it to a dashboard.
resources
| extend SQLversion = properties.version
| extend SQLEdition = properties.edition
| extend licensetype = properties.licenseType
| where type == ("microsoft.azurearcdata/sqlserverinstances")
| project id, name,SQLversion,SQLEdition, licensetype
Note: as of writing this, the property is ‘lincetype’ not ‘licensetype’ this will likely be corrected.

there are some minor edits to the query in this image, added ID and selected ‘formatted results’ so the record is linked.
We can now see the query on the dashboard and see the license types for the servers. We have a ‘Paid’ for sv5-su5-6320018 so we can configure BPA for both instances.

You can change the SQL Server Registration to automatically handle the licensing selection


To enable an assessment pick a Log Analytics Workspace, click “Enable assessment”

The prerequisites are listed here. One to make sure you have completed is.
The SQL Server built-in login NT AUTHORITY\SYSTEM must be the member of SQL Server sysadmin server role for all the SQL Server instances running on the machine.
We can see what resource the deployment creates.

checking the data collection rule

We can see the data source is the local files is checking for CSVs here
C:\Windows\System32\config\systemprofile\AppData\Local\Microsoft SQL Server Extension Agent\Assessment\*.csv
and uploading them into the table SqlAssessment_CL in the LA Workspace instance. We can see the table

Depending on your purpose you may want to consider changing the table settings.

Depending on the size of the servers and the number of databases it might take a while to run. The default schedule is weekly but adjustable.

Once its completes you will be able to explore the results.

You can look at the query that is integrating the SqlAssessment_CL table. The data is being dumped into a single RawData field that needs to be parsed. This query will help you get a jump start on accessing the data.
There is a to explore with the Azure Arc SQL Extension and various ways to use the platform to provide more visibility and control over your SQL servers.

Azure Monitor Container Insights cost presets (preview)
Microsoft have recently added a new preview feature within the Azure portal to perform some cost optimization on the Container Insights data that is collected to a Log Analytics workspace. This is helpful as going with the default collection could leave you with unnecessary cost, as you don’t care about particular namespaces, or you’ve got a non-production cluster, so don’t care about collecting data every minute, but still want to monitor your cluster and workloads.
Here’s how you can quickly set this up.
From the Azure Portal, open up the blade for your Kubernetes resource (works for both AKS and Arc enabled Kubernetes
Navigate to Monitoring / Insights and then Configure azure monitor (If you’ve not previously enabled it)

If you have configure container insights previously, click on Monitor Settings :

From the blade that’s opened, you’ll need to make sure that Use Managed Identity (preview) is enabled. This appears for Azure Arc for Kubernetes enabled clusters. If this isn’t checked, you will find the Costs presets (preview) list box is grayed out.

From the list box, you can choose from the following profiles:
Standard
Cost-optimized
Custom
None
Standard profile has the following settings:
1 minute collection frequency
No namespace filtering
Syslog collection disabled

Cost-optimized profile has the following settings:
5 minute collection frequency
3 namespaces excluded [kube-system, gatekeeper-system, azure-arc]
Syslog collection disabled

You can use the defined standards as the basis for your own custom collection profile.
Select a profile from the drop down and click on Edit collection settings.

You can now modify the configuration to meet your requirements. For ContainerLog filtering, you can use the link here for more information. The profile will be saved as Custom within the Cost presets list box.
You can also enable Syslog collection for security events on your nodes, but that will increase your Log Analytic costs somewhat, depending on how busy your cluster is!
Topic Search
-
 Securing TLS in WAC (Windows Admin Center) https://t.co/klDc7J7R4G
Posts by Date
- March 2025 1
- February 2025 1
- October 2024 1
- August 2024 1
- July 2024 1
- October 2023 1
- September 2023 1
- August 2023 3
- July 2023 1
- June 2023 2
- May 2023 1
- February 2023 3
- January 2023 1
- December 2022 1
- November 2022 3
- October 2022 7
- September 2022 2
- August 2022 4
- July 2022 1
- February 2022 2
- January 2022 1
- October 2021 1
- June 2021 2
- February 2021 1
- December 2020 2
- November 2020 2
- October 2020 1
- September 2020 1
- August 2020 1
- June 2020 1
- May 2020 2
- March 2020 1
- January 2020 2
- December 2019 2
- November 2019 1
- October 2019 7
- June 2019 2
- March 2019 2
- February 2019 1
- December 2018 3
- November 2018 1
- October 2018 4
- September 2018 6
- August 2018 1
- June 2018 1
- April 2018 2
- March 2018 1
- February 2018 3
- January 2018 2
- August 2017 5
- June 2017 2
- May 2017 3
- March 2017 4
- February 2017 4
- December 2016 1
- November 2016 3
- October 2016 3
- September 2016 5
- August 2016 11
- July 2016 13