
Azure Monitor Container Insights cost presets (preview)
Microsoft have recently added a new preview feature within the Azure portal to perform some cost optimization on the Container Insights data that is collected to a Log Analytics workspace. This is helpful as going with the default collection could leave you with unnecessary cost, as you don’t care about particular namespaces, or you’ve got a non-production cluster, so don’t care about collecting data every minute, but still want to monitor your cluster and workloads.
Here’s how you can quickly set this up.
From the Azure Portal, open up the blade for your Kubernetes resource (works for both AKS and Arc enabled Kubernetes
Navigate to Monitoring / Insights and then Configure azure monitor (If you’ve not previously enabled it)

If you have configure container insights previously, click on Monitor Settings :

From the blade that’s opened, you’ll need to make sure that Use Managed Identity (preview) is enabled. This appears for Azure Arc for Kubernetes enabled clusters. If this isn’t checked, you will find the Costs presets (preview) list box is grayed out.

From the list box, you can choose from the following profiles:
Standard
Cost-optimized
Custom
None
Standard profile has the following settings:
1 minute collection frequency
No namespace filtering
Syslog collection disabled

Cost-optimized profile has the following settings:
5 minute collection frequency
3 namespaces excluded [kube-system, gatekeeper-system, azure-arc]
Syslog collection disabled

You can use the defined standards as the basis for your own custom collection profile.
Select a profile from the drop down and click on Edit collection settings.

You can now modify the configuration to meet your requirements. For ContainerLog filtering, you can use the link here for more information. The profile will be saved as Custom within the Cost presets list box.
You can also enable Syslog collection for security events on your nodes, but that will increase your Log Analytic costs somewhat, depending on how busy your cluster is!
Azure Arc delivers SQL Databases as Resources in Azure
The SQL extension for Arc-connected servers itself isn’t new, however, it has had a new feature added that is currently in preview; which is the ability to create Azure resources that represent your SQL Database through the Arc-connected Servers.
You can see this will detect objects for SQL instances, named SQL instances, and the databases themselves become objects in Azure

If you already have this installed this is one configuration setting you may want to check and that is “Has NT AUTHORITY\SYSTEM in the sysadmin role.” This is listed in the prerequisites of the install instructions that can be found here View SQL Server databases - SQL Server | Microsoft Learn
It is worth noting this currently works only for the Microsoft.HybridCompute type and not for example the VMware connected Arc systems Microsoft.ConnectedVMwarevSphere.

There are some properties here listed as unknown however, this is a bug that has already been fixed.
This is the next step to bringing SQL databases into the Azure control plane, creating alerts on recovery models, encryption state, or perhaps statistic creation. Enabling more visibility and control into the Hybrid Cloud journey.
This is the first public preview of this feature and I’ll definitely be keeping an eye out for future revisions and enhancements.

Azure Arc Connected vSphere (Preview)
This isn’t a groundbreaking demo in terms of the end result; we deploy some VMs, however, the interesting conversation is about how we got there and what we can do with these VMs. With Azure Arc, we can now connect vSphere to the Azure platform, meaning using Azure we can use cloud methods to deploy servers such as Azure templates. This is a step towards creating an environment with a single-pane-of-glass, at least to view and query your IT estate.
The features today are simple, but Azure is a constantly evolving platform and when you are connected, as new features and services are developed and released, and the ecosystem evolves, you can grow with it.
The goal of this article is to give you some ideas about why connecting your vSphere cluster to Azure via Azure Arc and how having VMWare-connected VMs can start providing a path to a consistent cloud experience. This allows administrators to develop management processes in the cloud without requiring a complete lift and shift of all existing servers. As of this writing, this feature is still in preview.
This is assuming you have deployed the Azure Arc bridge to connect your on-premises resources. This process is evolving and is not meant to be the focus of this article.
Once connected using the Azure portal, you can do a simple VM deployment.
Click, click, VM name, deploy-demo-01 next, next, finish.
We can save this as an ARM template, I created a template spec and saved it to Azure, which I am using through the portal to deploy VM deploy-demo-02 but you could use pipeline tools such as Azure DevOps or other CI/CD tooling or templates from PowerShell command line.
You could use PowerShell to deploy that ARM Template to deploy deploy-demo-03
you could convert this into a Bicep template if that’s your standard.
What I do have now is 3 new vSphere hosted VMs all deployed via Azure ARM
however, I never touched the VMware console, and I now have an Azure Resource object.

You have access to basic controls. You could assign this via Azure RBAC rather than having administrators and users needing to access the vSphere console. There are options for resizing, adding disks, and managing networking, standardizing the experience.
In addition, you can also onboard existing deployed vSphere VMs and enable guest management to help manage things like VMware tools versions from Azure.

While the monitoring agent options are changing, I’ll keep this simple. You could also include VM extension such as the monitoring agent in your template.

which in term allows us to query these servers via Log analytics. This means it can be connected to alerts like low disk space and other services like Azure Policy.
This space is changing, there are a lot of new features coming to Azure Arc which we see as a gateway to connecting your existing IT servers to Azure allowing companies to gain the benefits of Azure without having to execute migrations for every server.
Hopefully, you found this insightful or informative
Azure Arc Connected K8s Billing usage workbook error - 'union' operator: Failed to resolve table expression named 'ContainerLogV2'
Using ‘Container Insights’ for Kubernetes can get expensive, I recently saw a customer creating 19TB of logs a month from logging container insights from an AKS cluster.
You may want to check what logs you are capturing as suggested through Microsoft guides Monitoring cost for Container insights - Azure Monitor | Microsoft Docs which suggests one of the first steps to check billing usage.
As of writing this if you enable container insights and try to view Data Usage you get an error. ‘union' operator: Failed to resolve table expression named 'ContainerLogV2’. ContainerLogV2 is in preview or if you are just aren’t ready to deploy that, here is how to fix the report manually. I also have included the Full report at the end.
However, depending on when you deploy this and how you deployed insight metrics you may hit this error.

As of writing this, ContainerLogV2 is in preview and you can follow this guide to deploy it. Configure the ContainerLogV2 schema (preview) for Container Insights - Azure Monitor | Microsoft Docs. If you want to gain some quick insight into your usage you can edit the workbook. We just need to get through the maze of edits to get to the underlying query.
Select ‘Azure Arc’ services
select ‘Kubernetes clusters’ under infrastructure
select your K8s cluster
select ‘Workbooks’ under Monitoring
select ‘Container Insights Usage’ workbook
you can either edit this one or ‘Save As’ and create a new name. I will create a copy.
Open your chosen workbook

you can now edit the group item.

by Namespace

Editing the Namespace selection Dropdown parameter query
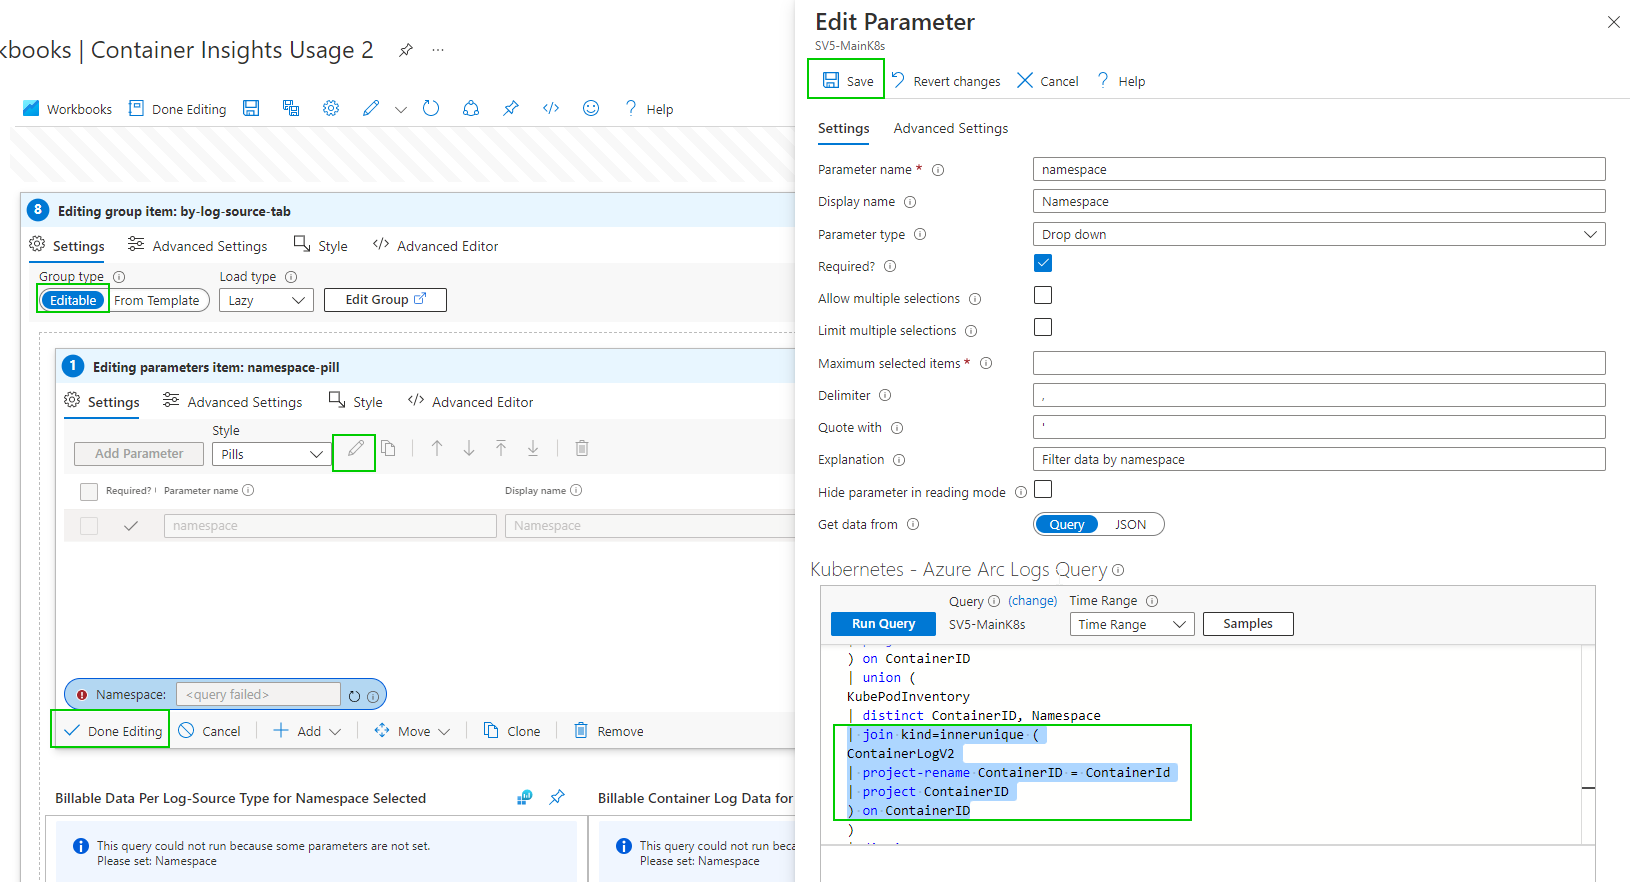
Hopefully, you get the gist of the process. There are a few more queries to edit.

And


This will now work for Data Usage. This is likely a temporary solution until ContainerLogV2 comes out of preview. Configure the ContainerLogV2 schema (preview) for Container Insights - Azure Monitor | Microsoft Docs
Gallery Template code
{
"version": "Notebook/1.0",
"items": [
{
"type": 9,
"content": {
"version": "KqlParameterItem/1.0",
"crossComponentResources": [
"{resource}"
],
"parameters": [
{
"id": "670aac26-0ffe-4f29-81c2-d48911bc64b6",
"version": "KqlParameterItem/1.0",
"name": "timeRange",
"label": "Time Range",
"type": 4,
"description": "Select time-range for data selection",
"isRequired": true,
"value": {
"durationMs": 21600000
},
"typeSettings": {
"selectableValues": [
{
"durationMs": 300000
},
{
"durationMs": 900000
},
{
"durationMs": 3600000
},
{
"durationMs": 14400000
},
{
"durationMs": 43200000
},
{
"durationMs": 86400000
},
{
"durationMs": 172800000
},
{
"durationMs": 259200000
},
{
"durationMs": 604800000
},
{
"durationMs": 1209600000
},
{
"durationMs": 2419200000
},
{
"durationMs": 2592000000
},
{
"durationMs": 5184000000
},
{
"durationMs": 7776000000
}
],
"allowCustom": true
}
},
{
"id": "bfc96857-81df-4f0d-b958-81f96d28ddeb",
"version": "KqlParameterItem/1.0",
"name": "resource",
"type": 5,
"isRequired": true,
"isHiddenWhenLocked": true,
"typeSettings": {
"additionalResourceOptions": [
"value::1"
],
"showDefault": false
},
"timeContext": {
"durationMs": 21600000
},
"timeContextFromParameter": "timeRange",
"defaultValue": "value::1"
},
{
"id": "8d48ec94-fde6-487c-98bf-f1295f5d8b81",
"version": "KqlParameterItem/1.0",
"name": "resourceType",
"type": 7,
"description": "Resource type of resource",
"isRequired": true,
"query": "{\"version\":\"1.0.0\",\"content\":\"\\\"{resource:resourcetype}\\\"\",\"transformers\":null}",
"isHiddenWhenLocked": true,
"typeSettings": {
"additionalResourceOptions": [
"value::1"
],
"showDefault": false
},
"timeContext": {
"durationMs": 21600000
},
"timeContextFromParameter": "timeRange",
"defaultValue": "value::1",
"queryType": 8
},
{
"id": "1b826776-ab99-45ab-86db-cced05e8b36d",
"version": "KqlParameterItem/1.0",
"name": "clusterId",
"type": 1,
"description": "Used to identify the cluster name when the cluster type is AKS Engine",
"isHiddenWhenLocked": true,
"timeContext": {
"durationMs": 0
},
"timeContextFromParameter": "timeRange"
},
{
"id": "67227c35-eab8-4518-9212-1c3c3d564b20",
"version": "KqlParameterItem/1.0",
"name": "masterNodeExists",
"type": 1,
"query": "let MissingTable = view () { print isMissing=1 };\r\nlet masterNodeExists = toscalar(\r\nunion isfuzzy=true MissingTable, (\r\nAzureDiagnostics \r\n| getschema \r\n| summarize c=count() \r\n| project isMissing=iff(c > 0, 0, 1)\r\n) \r\n| top 1 by isMissing asc\r\n);\r\nprint(iif(masterNodeExists == 0, 'yes', 'no'))\r\n",
"crossComponentResources": [
"{resource}"
],
"isHiddenWhenLocked": true,
"timeContext": {
"durationMs": 0
},
"timeContextFromParameter": "timeRange",
"queryType": 0,
"resourceType": "{resourceType}"
}
],
"style": "pills",
"queryType": 0,
"resourceType": "{resourceType}"
},
"name": "pills"
},
{
"type": 1,
"content": {
"json": "Please note that the Container Insights Usage workbook for AKS Engine clusters shows your billable data usage for your cluster's entire workspace ({resource:name}), and not just the cluster itself ({clusterId}). ",
"style": "info"
},
"conditionalVisibility": {
"parameterName": "resourceType",
"comparison": "isEqualTo",
"value": "microsoft.operationalinsights/workspaces"
},
"name": "aks-engine-billable-data-shown-applies-to-entire-workspace-not-just-the-cluster-info-message",
"styleSettings": {
"showBorder": true
}
},
{
"type": 11,
"content": {
"version": "LinkItem/1.0",
"style": "tabs",
"links": [
{
"id": "3b7d39f2-38c5-4586-a155-71e28e333020",
"cellValue": "selectedTab",
"linkTarget": "parameter",
"linkLabel": "Overview",
"subTarget": "overview",
"style": "link"
},
{
"id": "7163b764-7ab2-48b3-b417-41af3eea7ef0",
"cellValue": "selectedTab",
"linkTarget": "parameter",
"linkLabel": "By Table",
"subTarget": "table",
"style": "link"
},
{
"id": "960bbeea-357f-4c07-bdd9-6f3f123d56fd",
"cellValue": "selectedTab",
"linkTarget": "parameter",
"linkLabel": "By Namespace",
"subTarget": "namespace",
"style": "link"
},
{
"id": "7fbcc5bd-62d6-4aeb-b55e-7b1fab65716a",
"cellValue": "selectedTab",
"linkTarget": "parameter",
"linkLabel": "By Log Source",
"subTarget": "logSource",
"style": "link"
},
{
"id": "3434a63b-f3d5-4c11-9620-1e731983041c",
"cellValue": "selectedTab",
"linkTarget": "parameter",
"linkLabel": "By Diagnostic Master Node ",
"subTarget": "diagnosticMasterNode",
"style": "link"
}
]
},
"name": "tabs"
},
{
"type": 1,
"content": {
"json": "Due to querying limitation on Basic Logs, if you are using Basic Logs, this workbook provides partial data on your container log usage.",
"style": "info"
},
"conditionalVisibility": {
"parameterName": "selectedTab",
"comparison": "isEqualTo",
"value": "overview"
},
"name": "basic-logs-info-text"
},
{
"type": 12,
"content": {
"version": "NotebookGroup/1.0",
"groupType": "editable",
"title": "Container Insights Billing Usage",
"items": [
{
"type": 1,
"content": {
"json": "<br/>\r\nThis workbook provides you a summary and source for billable data collected by [Container Insights solution.](https://docs.microsoft.com/en-us/azure/azure-monitor/insights/container-insights-overview)\r\n\r\nThe best way to understand how Container Insights ingests data in Log Analytics workspace is from this [article.](https://medium.com/microsoftazure/azure-monitor-for-containers-optimizing-data-collection-settings-for-cost-ce6f848aca32)\r\n\r\nIn this workbook you can:\r\n\r\n* View billable data ingested by **solution**.\r\n* View billable data ingested by **Container logs (application logs)**\r\n* View billable container logs data ingested segregated by **Kubernetes namespace**\r\n* View billable container logs data ingested segregated by **Cluster name**\r\n* View billable container log data ingested by **logsource entry**\r\n* View billable diagnostic data ingested by **diagnostic master node logs**\r\n\r\nYou can fine tune and control logging by turning off logging on the above mentioned vectors. [Learn how to fine-tune logging](https://docs.microsoft.com/en-us/azure/azure-monitor/insights/container-insights-agent-config)\r\n\r\nYou can control your master node's logs by updating diagnostic settings. [Learn how to update diagnostic settings](https://docs.microsoft.com/en-us/azure/aks/view-master-logs)"
},
"name": "workbooks-explanation-text"
},
{
"type": 1,
"content": {
"json": "`Master node logs` are not enabled. [Learn how to enable](https://docs.microsoft.com/en-us/azure/aks/view-master-logs)"
},
"conditionalVisibility": {
"parameterName": "masterNodeExists",
"comparison": "isEqualTo",
"value": "no"
},
"name": "master-node-logs-are-not-enabled-msg"
}
]
},
"conditionalVisibility": {
"parameterName": "selectedTab",
"comparison": "isEqualTo",
"value": "overview"
},
"name": "workbook-explanation"
},
{
"type": 12,
"content": {
"version": "NotebookGroup/1.0",
"groupType": "editable",
"items": [
{
"type": 3,
"content": {
"version": "KqlItem/1.0",
"query": "union withsource = SourceTable AzureDiagnostics, AzureActivity, AzureMetrics, ContainerLog, Perf, KubePodInventory, ContainerInventory, InsightsMetrics, KubeEvents, KubeServices, KubeNodeInventory, ContainerNodeInventory, KubeMonAgentEvents, ContainerServiceLog, Heartbeat, KubeHealth, ContainerImageInventory\r\n| where _IsBillable == true\r\n| project _BilledSize, TimeGenerated, SourceTable\r\n| summarize BillableDataBytes = sum(_BilledSize) by bin(TimeGenerated, {timeRange:grain}), SourceTable\r\n| render piechart\r\n\r\n\r\n",
"size": 3,
"showAnnotations": true,
"showAnalytics": true,
"title": "Billable Data from Container Insights",
"timeContextFromParameter": "timeRange",
"queryType": 0,
"resourceType": "{resourceType}",
"crossComponentResources": [
"{resource}"
],
"chartSettings": {
"xAxis": "TimeGenerated",
"createOtherGroup": 100,
"seriesLabelSettings": [
{
"seriesName": "LogManagement",
"label": "LogManagementSolution(GB)"
},
{
"seriesName": "ContainerInsights",
"label": "ContainerInsightsSolution(GB)"
}
],
"ySettings": {
"numberFormatSettings": {
"unit": 2,
"options": {
"style": "decimal"
}
}
}
}
},
"customWidth": "50",
"showPin": true,
"name": "billable-data-from-ci"
}
]
},
"conditionalVisibility": {
"parameterName": "selectedTab",
"comparison": "isEqualTo",
"value": "table"
},
"name": "by-datatable-tab"
},
{
"type": 12,
"content": {
"version": "NotebookGroup/1.0",
"groupType": "editable",
"items": [
{
"type": 3,
"content": {
"version": "KqlItem/1.0",
"query": "KubePodInventory\r\n| distinct ContainerID, Namespace\r\n| join kind=innerunique (\r\nContainerLog\r\n| where _IsBillable == true\r\n| summarize BillableDataBytes = sum(_BilledSize) by ContainerID\r\n) on ContainerID\r\n| union (\r\nKubePodInventory\r\n| distinct ContainerID, Namespace\r\n)\r\n| summarize Total=sum(BillableDataBytes) by Namespace\r\n| render piechart\r\n",
"size": 3,
"showAnalytics": true,
"title": "Billable Container Log Data Per Namespace",
"timeContextFromParameter": "timeRange",
"queryType": 0,
"resourceType": "{resourceType}",
"crossComponentResources": [
"{resource}"
],
"tileSettings": {
"showBorder": false,
"titleContent": {
"columnMatch": "Namespace",
"formatter": 1
},
"leftContent": {
"columnMatch": "Total",
"formatter": 12,
"formatOptions": {
"palette": "auto"
},
"numberFormat": {
"unit": 17,
"options": {
"maximumSignificantDigits": 3,
"maximumFractionDigits": 2
}
}
}
},
"graphSettings": {
"type": 0,
"topContent": {
"columnMatch": "Namespace",
"formatter": 1
},
"centerContent": {
"columnMatch": "Total",
"formatter": 1,
"numberFormat": {
"unit": 17,
"options": {
"maximumSignificantDigits": 3,
"maximumFractionDigits": 2
}
}
}
},
"chartSettings": {
"createOtherGroup": 100,
"ySettings": {
"numberFormatSettings": {
"unit": 2,
"options": {
"style": "decimal"
}
}
}
}
},
"name": "billable-data-per-namespace"
}
]
},
"conditionalVisibility": {
"parameterName": "selectedTab",
"comparison": "isEqualTo",
"value": "namespace"
},
"name": "by-namespace-tab"
},
{
"type": 12,
"content": {
"version": "NotebookGroup/1.0",
"groupType": "editable",
"items": [
{
"type": 9,
"content": {
"version": "KqlParameterItem/1.0",
"crossComponentResources": [
"{resource}"
],
"parameters": [
{
"id": "d5701caa-0486-4e6f-adad-6fa5b8496a7d",
"version": "KqlParameterItem/1.0",
"name": "namespace",
"label": "Namespace",
"type": 2,
"description": "Filter data by namespace",
"isRequired": true,
"query": "KubePodInventory\r\n| distinct ContainerID, Namespace\r\n| join kind=innerunique (\r\nContainerLog\r\n| project ContainerID\r\n) on ContainerID\r\n| union (\r\nKubePodInventory\r\n| distinct ContainerID, Namespace\r\n)\r\n| distinct Namespace\r\n| project value = Namespace, label = Namespace, selected = false\r\n| sort by label asc",
"crossComponentResources": [
"{resource}"
],
"typeSettings": {
"additionalResourceOptions": [
"value::1"
],
"showDefault": false
},
"timeContext": {
"durationMs": 0
},
"timeContextFromParameter": "timeRange",
"defaultValue": "value::1",
"queryType": 0,
"resourceType": "{resourceType}"
}
],
"style": "pills",
"queryType": 0,
"resourceType": "{resourceType}"
},
"name": "namespace-pill"
},
{
"type": 3,
"content": {
"version": "KqlItem/1.0",
"query": "KubePodInventory\r\n| where Namespace == '{namespace}'\r\n| distinct ContainerID, Namespace\r\n| join hint.strategy=shuffle (\r\nContainerLog\r\n| where _IsBillable == true\r\n| summarize BillableDataBytes = sum(_BilledSize) by LogEntrySource, ContainerID\r\n) on ContainerID\r\n| union (\r\nKubePodInventory\r\n| where Namespace == '{namespace}'\r\n| distinct ContainerID, Namespace\r\n)\r\n| extend sourceNamespace = strcat(LogEntrySource, \"/\", Namespace)\r\n| summarize Total=sum(BillableDataBytes) by sourceNamespace\r\n| render piechart",
"size": 0,
"showAnnotations": true,
"showAnalytics": true,
"title": "Billable Data Per Log-Source Type for Namespace Selected",
"timeContextFromParameter": "timeRange",
"queryType": 0,
"resourceType": "{resourceType}",
"crossComponentResources": [
"{resource}"
],
"chartSettings": {
"createOtherGroup": 100,
"ySettings": {
"numberFormatSettings": {
"unit": 2,
"options": {
"style": "decimal"
}
}
}
}
},
"customWidth": "35",
"showPin": true,
"name": "billable-data-per-log-source",
"styleSettings": {
"showBorder": true
}
},
{
"type": 3,
"content": {
"version": "KqlItem/1.0",
"query": "KubePodInventory\r\n| where Namespace == '{namespace}'\r\n| distinct ContainerID, Namespace\r\n| project ContainerID\r\n| join hint.strategy=shuffle ( \r\nContainerLog\r\n| project _BilledSize, ContainerID, TimeGenerated, LogEntrySource\r\n) on ContainerID\r\n| union (\r\nKubePodInventory\r\n| where Namespace == '{namespace}'\r\n| distinct ContainerID, Namespace\r\n| project ContainerID\r\n)\r\n| summarize ContainerLogData = sum(_BilledSize) by bin(TimeGenerated, {timeRange:grain}), LogEntrySource\r\n| render linechart\r\n\r\n",
"size": 0,
"showAnnotations": true,
"showAnalytics": true,
"title": "Billable Container Log Data for Namespace Selected",
"timeContextFromParameter": "timeRange",
"queryType": 0,
"resourceType": "{resourceType}",
"crossComponentResources": [
"{resource}"
],
"chartSettings": {
"xSettings": {},
"ySettings": {
"numberFormatSettings": {
"unit": 2,
"options": {
"style": "decimal"
}
}
}
}
},
"customWidth": "65",
"conditionalVisibility": {
"parameterName": "namespace:label",
"comparison": "isNotEqualTo",
"value": "<unset>"
},
"showPin": true,
"name": "billable-container-log-data-for-namespace-selected",
"styleSettings": {
"showBorder": true
}
}
]
},
"conditionalVisibility": {
"parameterName": "selectedTab",
"comparison": "isEqualTo",
"value": "logSource"
},
"name": "by-log-source-tab"
},
{
"type": 12,
"content": {
"version": "NotebookGroup/1.0",
"groupType": "editable",
"items": [
{
"type": 1,
"content": {
"json": "`Master node logs` are not enabled. [Learn how to enable](https://docs.microsoft.com/en-us/azure/aks/view-master-logs)"
},
"conditionalVisibility": {
"parameterName": "masterNodeExists",
"comparison": "isEqualTo",
"value": "no"
},
"name": "master-node-logs-are-not-enabled-msg-under-masternode-tab"
},
{
"type": 3,
"content": {
"version": "KqlItem/1.0",
"query": "AzureDiagnostics\r\n| summarize Total=sum(_BilledSize) by bin(TimeGenerated, {timeRange:grain}), Category\r\n| render barchart\r\n\r\n\r\n",
"size": 0,
"showAnnotations": true,
"showAnalytics": true,
"title": "Billable Diagnostic Master Node Log Data",
"timeContextFromParameter": "timeRange",
"queryType": 0,
"resourceType": "{resourceType}",
"crossComponentResources": [
"{resource}"
],
"chartSettings": {
"ySettings": {
"unit": 2,
"min": null,
"max": null
}
}
},
"customWidth": "75",
"conditionalVisibility": {
"parameterName": "masterNodeExists",
"comparison": "isEqualTo",
"value": "yes"
},
"showPin": true,
"name": "billable-data-from-diagnostic-master-node-logs"
}
]
},
"conditionalVisibility": {
"parameterName": "selectedTab",
"comparison": "isEqualTo",
"value": "diagnosticMasterNode"
},
"name": "by-diagnostic-master-node-tab"
}
],
"fallbackResourceIds": [
"/subscriptions/357e7522-d1ad-433c-9545-7d8b8d72d61a/resourceGroups/ArcResources/providers/Microsoft.Kubernetes/connectedClusters/sv5-k8sdemo"
],
"fromTemplateId": "community-Workbooks/AKS/Billing Usage Divided",
"$schema": "https://github.com/Microsoft/Application-Insights-Workbooks/blob/master/schema/workbook.json"
}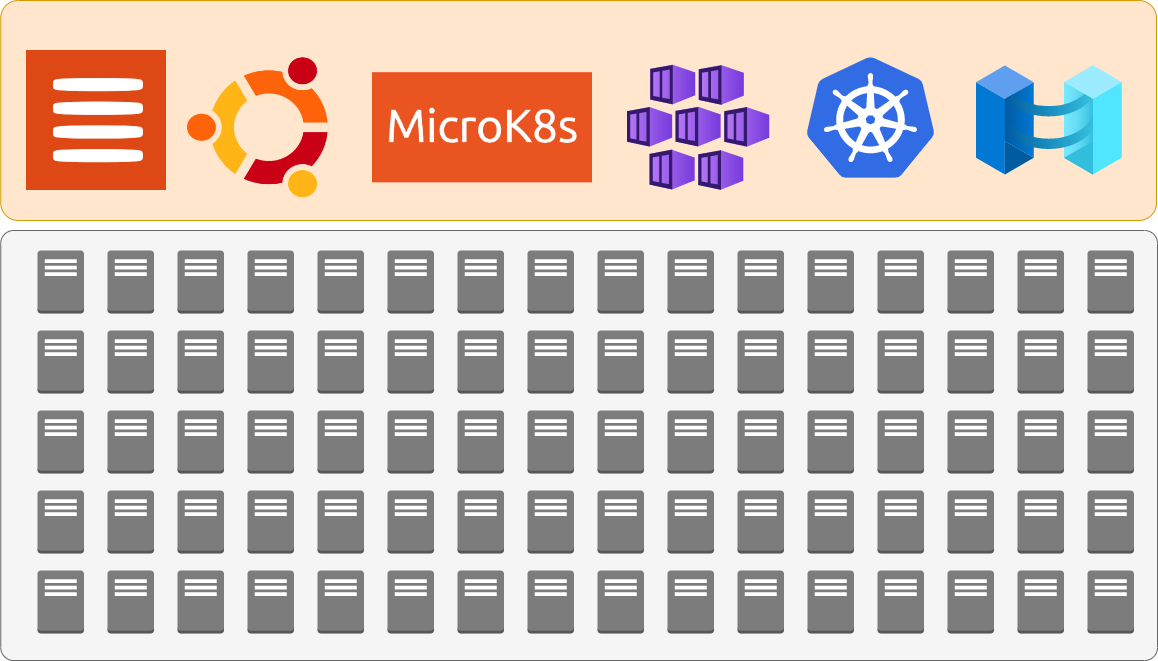
Deploying 100+ node MicroK8s Kubernetes Cluster connected to Azure with Arc
Using MAAS to deploy 121 physical nodes with ubuntu installing MicroK8s from the cloud-init and connecting the cluster to Azure using Azure Arc
How long would it take to deploy 100+ physical servers with Ubuntu, create a microK8s cluster and connect it to Azure using Azure Arc?
This post walks through the process of creating and connecting a MicroK8s cluster to Azure using Azure Arc, MAAS, Ubuntu, and Micok8s.
First need a primary server to start the K8s cluster so let’s deploy one
Lets create a Tag ‘AzureConnectedMicroK8s’ so we can keep track of the servers we are deploying
While we are waiting for the deployment let’s head over to MicroK8s - Zero-ops Kubernetes for developers, edge and IoT website, and let’s look up the commands for creating a MicroK8s cluster using snaps and we want to use a specific version 1.24
sudo apt-get update
sudo apt-get upgrade -y
sudo snap install microk8s --classic --channel=1.24
sudo microk8s status --wait-ready
We need to extend the life of the join token so we reuse it for multiple servers MicroK8s - Command reference shows we do this with —token-ttl switch
sudo microk8s add-node --token-ttl 9999999I want to use the cloud-init commands with MAAS to deploy the Ubuntu and join it automatically to the microK8s cluster, so lets build that script. We will try two one the pull updates and one that doesn’t. Let’s Tag these 2 new nodes we are adding first.
#!/bin/bash
sudo apt-get update
sudo apt-get upgrade -y
sudo snap install microk8s --classic --channel=1.24
# updated content to include a random delay for adding lots of nodes
randomNumber=$((10 + $RANDOM % 240))
sleep randomNumber
sudo microk8s join 172.30.9.31:25000/8a4fb96dd8c711aaa895ba0da2e0dd91/fb637a6f6f64We can check the deployment and look for the additional nodes using kubectl command
# let’s create a Kube config file
mkdir ~/.kube
sudo microk8s kubectl config view --raw > $HOME/.kube/config
sudo usermod -aG microk8s $USER
# fix permissions for Helm warning
chmod go-r ~/.kube/config

sudo snap install kubectl --classic
kubectl version --client

kubectl cluster-info

# Add auto completion and Alias for kubectl
sudo apt-get install -y bash-completion
echo 'source <(kubectl completion bash)' >>~/.bashrc
echo 'alias k=kubectl' >>~/.bashrc
echo 'complete -o default -F __start_kubectl k' >>~/.bashrc
# need to restart session to use for alias


kubectl get nodes

# using k Alias
k get nodes
k get nodes -o wide
lets get K8s dashboard running
sudo microk8s enable dashboard ingress storage

# add MAAS DNS servers
sudo microk8s enable dns:172.30.0.30,172.30.0.32

# DNS trouble shooting
# https://kubernetes.io/docs/tasks/administer-cluster/dns-debugging-resolution/

k -n kube-system edit service kubernetes-dashboard
# change change type from ClusterPort to NodePort ~approx line 35

# save this token for later use
k create token -n kube-system default --duration=8544h

k describe service/kubernetes-dashboard -n kube-system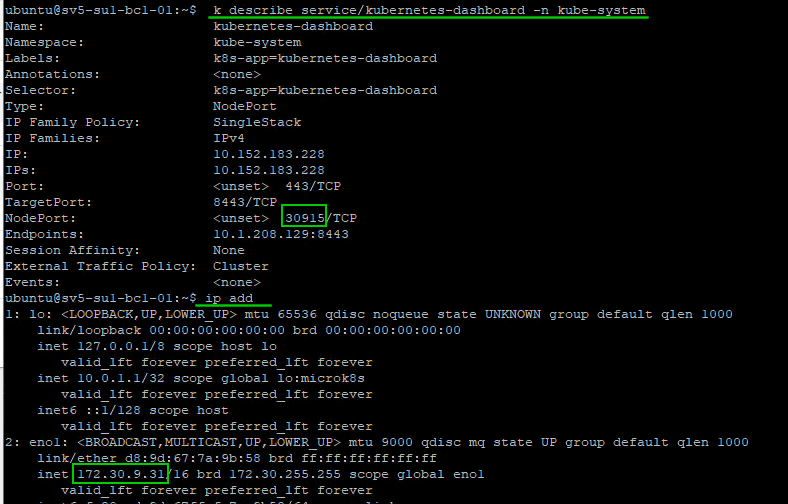

Next, let’s deploy some workers from MAAS and tag the servers accordingly

#!/bin/bash
sudo apt-get update
sudo apt-get upgrade -y
sudo snap install microk8s --classic --channel=1.24
sudo microk8s join 172.30.9.31:25000/8a4fb96dd8c711aaa895ba0da2e0dd91/fb637a6f6f64 --worker
While waiting for there workers I am going to use choco to install octant. “choco install octant”. Create a copy of the linux kube-config. Creating a local ‘config’ file on my windows desktop in the user\.kube directory and then running octant.exe we can then access the dashboard via http://127.0.0.1:7777 which shows us the new workers we have just added.
Let’s work to connect the cluster to Azure using the following guide Quickstart: Connect an existing Kubernetes cluster to Azure Arc - Azure Arc | Microsoft Docs. First lets make sure the resource providers are registered

# Using Powershell

Get-AzResourceProvider -ProviderNamespace Microsoft.Kubernetes
Get-AzResourceProvider -ProviderNamespace Microsoft.KubernetesConfiguration
Get-AzResourceProvider -ProviderNamespace Microsoft.ExtendedLocation
Adding a role assignment to my user account for ‘Kubernetes Cluster - Azure Arc Onboarding’ and ‘Azure Arc Kubernetes Cluster Admin’. Depending on your onboarding account and process this may vary.
# run on master node
sudo microk8s enable helm3
sudo snap install helm --classic

# install Azure CLI
curl -sL https://aka.ms/InstallAzureCLIDeb | sudo bash

az login
# User browser devicelogin code

az account show
# use 'az account set --subscription subname' to ensure you have correct subscription

az extension add --name connectedk8s
az extension add --name k8s-configuration

# using an existing resource group
az connectedk8s connect --name sv5-microk8s --resource-group ArcResources

# trouble shooting
# https://docs.microsoft.com/en-us/azure/azure-arc/kubernetes/troubleshooting#enable-custom-locations-using-service-principal
While this is deploying you can open another connection and run
“k -n azure-arc get pods,deployments”
if Azure Arc is experiencing any errors trying to create the deployments you can query the pod logs using “k -n azure-arc logs <pod-name>”
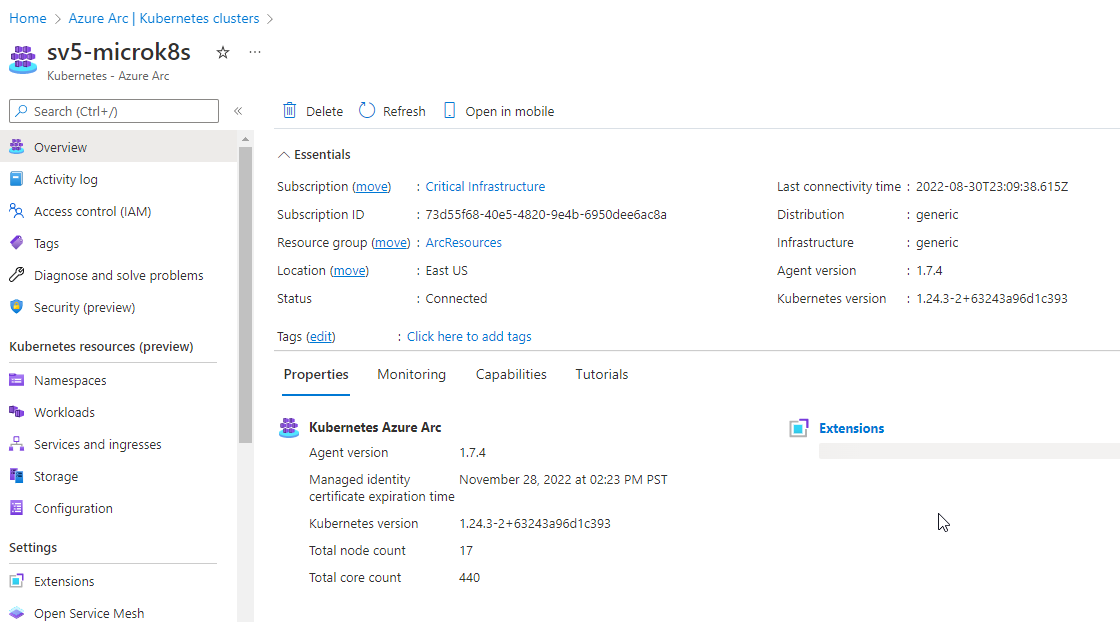
Checking Azure Resource Group we can see the resource being created and can see the total node count of 7, and the total core count of 160.
using the token we saved you can now sign into the on-premise cluster from Azure

You can now explore the namespaces, workloads, services, etc from the Azure Portal
Lets scale this out and show you how easily you can create a large-scale K8s cluster using your old hardware managed by MAAS and connected to Azure using Azure Arc. Using the same work join command as before in the cloud-init script lets deploy 10 new physical servers from MAAS and add them directly to the K8s cluster as workers.

And we can see the node count has increased to 17.
I do expect some failures here with servers as we are still onboarding some hardware and cleaning up issues but let’s grab all the ready servers and see how well Ubuntu, MAAS, MicroK8s, and Azure Arc can handle this scale out.


There Obviously adding that many servers can stress the system. Some errors around pulling the images for the networking, but just leaving them for a few hours they self-corrected and completed the deployment, and joined the cluster successfully.
We do have some internal MTU sizing issues in the switches so not all hosts were added. Looking at the Daemon sets under workloads we can see the calico and nginx pods 121 ready out of 121 deployed.

Looking at the node count we have 121 nodes added and 5452 CPU cores ready to work. That’s a lot of power you can now leverage to run container-based deployments.

Overall this was fairly easy to reuse a wide range of new and old hardware and create a large Kubernetes cluster and connect it to the Azure Portal via Azure Arc. This cluster could be used for a wide range of services including custom container hosting or Azure delivered services like Azure SQL or Machine learning.
We will continue to explore Azure Arc-connected services.
Explore
Quickstart: Connect an existing Kubernetes cluster to Azure Arc - Azure Arc | Microsoft Docs
MAAS (Metal-as-a-Service) Full HA Installation — Crying Cloud
Configure Kubernetes cluster - Azure Machine Learning | Microsoft Docs
Supporting Content
Topic Search
-
 Securing TLS in WAC (Windows Admin Center) https://t.co/klDc7J7R4G
Posts by Date
- March 2025 1
- February 2025 1
- October 2024 1
- August 2024 1
- July 2024 1
- October 2023 1
- September 2023 1
- August 2023 3
- July 2023 1
- June 2023 2
- May 2023 1
- February 2023 3
- January 2023 1
- December 2022 1
- November 2022 3
- October 2022 7
- September 2022 2
- August 2022 4
- July 2022 1
- February 2022 2
- January 2022 1
- October 2021 1
- June 2021 2
- February 2021 1
- December 2020 2
- November 2020 2
- October 2020 1
- September 2020 1
- August 2020 1
- June 2020 1
- May 2020 2
- March 2020 1
- January 2020 2
- December 2019 2
- November 2019 1
- October 2019 7
- June 2019 2
- March 2019 2
- February 2019 1
- December 2018 3
- November 2018 1
- October 2018 4
- September 2018 6
- August 2018 1
- June 2018 1
- April 2018 2
- March 2018 1
- February 2018 3
- January 2018 2
- August 2017 5
- June 2017 2
- May 2017 3
- March 2017 4
- February 2017 4
- December 2016 1
- November 2016 3
- October 2016 3
- September 2016 5
- August 2016 11
- July 2016 13